Analysis of tricot data
Kauê de Sousa, Joost van Heerwaarden, Hugo Dorado
Analytical framework
Overview of statistical models
Tools for analyzing ranking data
Tricot data consist of rankings, an unusual data type in the agricultural sciences, in spite of some experience with it in participatory research (Coe, 2002). As indicated in section 2, the tricot approach relies much on the Plackett-Luce model. The Plackett-Luce model also allows for the inclusion of covariates using recursive partitioning, which uses binary splits (Strobl, Wickelmaier and Zeileis, 2011). At the moment, the Plackett-Luce package is being expanded to include Plackett-Luce regression, which uses linear covariates (Yildiz et al., 2020).
Van Etten et al., (2019) showed how the Plackett-Luce model can be used in combination with seasonal climate data and cross-validations to produce robust, locally-specific variety recommendations. Tricot data analysis has recently expanded into two directions.
Firstly, Brown et al., (2020) have described how the Plackett-Luce model can be used to synthesize trial data from across different trials. Ongoing work is doing this with tricot trials (and other trials, after converting absolute values to ranks to deal with highly heterogeneous data). This is a promising new direction, as it will show in the future that working with a standardized approach like tricot and sharing data openly has strong benefits for science in general and generates recognition for individual scientists who decide to publish their data. Also, it may stimulate data publication from trials that are not worth a peer-reviewed journal article on their own but gain value after being combined with data from other trials.
In their paper, de Sousa et al. (2020) take the Plackett-Luce model in another direction, by adding genomic relatedness data to the model (as a covariance matrix). This increased the predictivity of the model in an important measure, showing that it may be feasible and relevant to use relatedness data to allow for more diverse sets of materials to be tested by farmers. This may require important changes in breeding approaches but it provides an interesting prospect.
The new Plackett-Luce regression approach will also allow the use of variety traits as covariates (Yildiz et al., 2020). This opens interesting possibilities to analyze the relative influence of known trait values on on-farm performance. It will also possibly provide avenues to link tricot results with trait prioritization exercises.
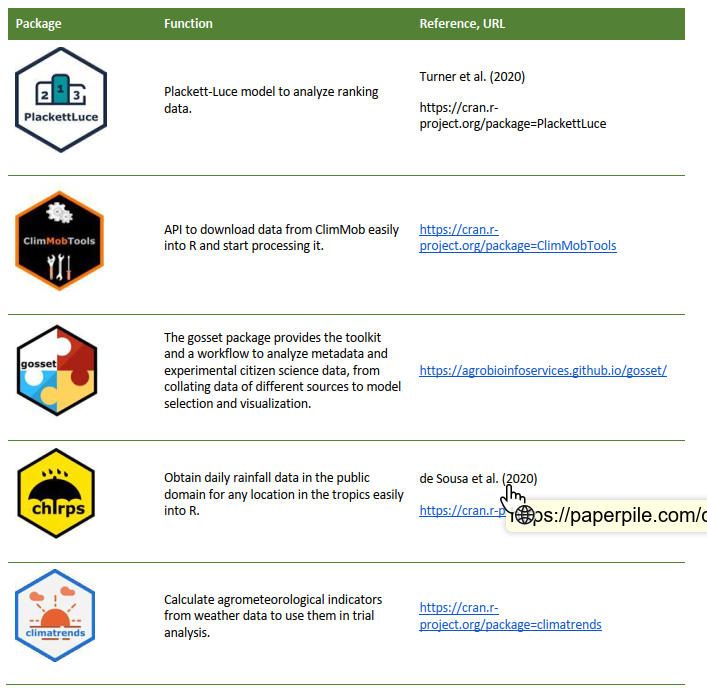
Data analysis has also been increasingly supported by implementing the existing code, which was generated to a large degree for the analyses presented in (van Etten et al., 2019), into R packages. The R packages that have been generated as a result from this research are listed in Table 2.
Visualization
Integration with other datasets (agroclimatic, soil, and socio-economic data)
Integration of on farm and station data
One of the goals of on-farm testing is to get insights into genetic gain achieved by breeding programmes. Some aspects of genetic gain are related to traits that are highly heritable so that on-farm performance is not different from on-station performance. For example, the color of the product may not be affected by genotype by environment interactions. An aspect of genetic gain that is important as a goal shared by most breeding programmes is the yield. As tricot is based mainly on rankings, generally yield estimations have been provided in that form. This provides an insight into the yield-based reliability, the probability that a new variety will outperform the current market leader, an important indicator for breeders and product managers to make decisions (Eskridge and Mumm, 1992). The CGIAR Excellence in Breeding strategy focuses on product profiles that emphasize cumulative gains towards product replacement, taking over market share from existing varieties (Cobb et al., 2019). Tricot is well suited to address the challenge of providing early indicators of the probability that product replacement happens.
In many cases, however, breeders need to have absolute estimates of yield levels, for example because this is a requirement for a variety release procedure. In one case, a subset of the fields has been visited to obtain yield estimates (NextGen Cassava), in other cases, all fields were visited for yield measurements (de Sousa et al., 2020). This ‘undermines’ the tricot approach to some degree in the sense that the field visits become an important cost driver. This leads to the question whether farmers themselves can provide reliable yield estimates.
Ochieng, Ojime, and Otieno (2019) have addressed this question by comparing yield estimates by researchers (taking into account grain moisture) and by farmers (volumetric, using 250 ml tins). They set up an experiment with common bean (P. vulgaris) in Kenya. They obtained a high correlation between the two types of measurements when all seasons and locations were aggregated (r = 0.98). When differences were smaller than 0.5 t/ha, the match between values provided by farmers and researchers decreased. We aim to replicate these studies in other contexts with other crops in order to get a better grip on the accuracy of farmers’ measurements and to use these accuracy estimates in statistical analyses. On the other hand, these studies will provide insights in how to maximize farmers’ accuracy.
It would be ideal to be able to combine yield ranking data and yield measurement data when the measurement data is only available for a part of the trial. It is possible to feed absolute measurements and ordinal (ranking) data into the same statistical model, directly (Böckenholt 2004) or through a Bayesian approach. This has not been implemented in software yet; this is a pending task.