Implements the Luce's Choice Axiom to calculate pairwise probabilities in a set of choice probabilities. The Luce's Choice Axiom states that the probability of selecting one item over another from a pool of many items is not affected by the presence or absence of other items in the pool.
pairwise_probs(object, relative.probs = TRUE, ...)Arguments
Value
a matrix with pairwise probabilities
Examples
library("PlackettLuce")
library("ggplot2")
R = matrix(c(1, 2, 3, 0,
4, 1, 2, 3,
2, 1, 3, 4,
1, 2, 3, 0,
2, 1, 3, 0,
1, 0, 3, 2), nrow = 6, byrow = TRUE)
colnames(R) = c("apple", "banana", "grape", "pear")
mod = PlackettLuce(R)
coefs = coefficients(mod, log = FALSE)
pair_worth = pairwise_probs(coefs)
pair_worth
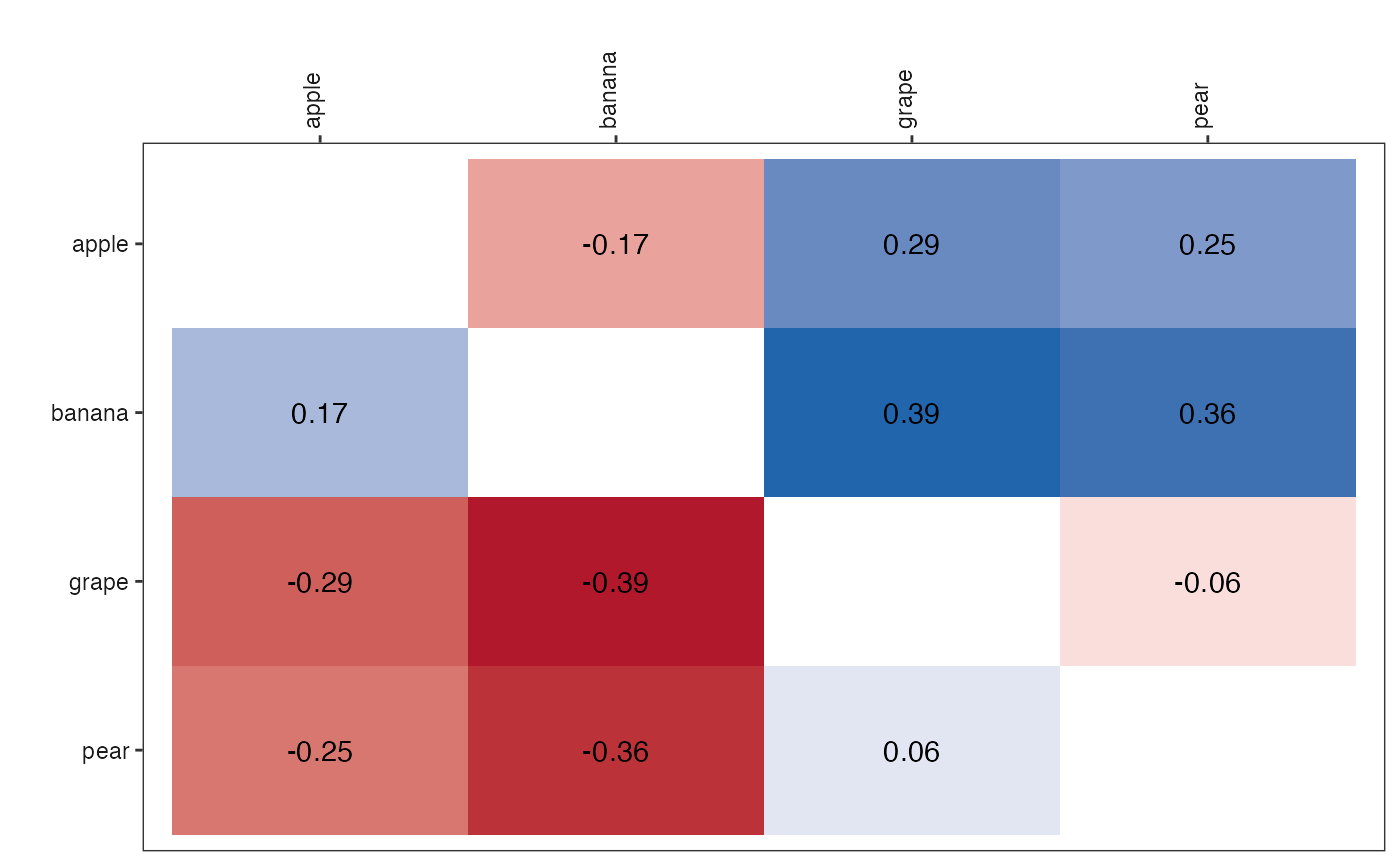
#> pear grape banana apple
#> pear NA 0.06 -0.36 -0.25
#> grape -0.06 NA -0.39 -0.29
#> banana 0.36 0.39 NA 0.17
#> apple 0.25 0.29 -0.17 NA
# plot the results
lvls = dimnames(pair_worth)[[1]]
pair_dat = data.frame(player1 = rep(lvls, times = length(lvls)),
player2 = rep(lvls, each = length(lvls)),
worth = as.vector(pair_worth))
pair_dat
#> player1 player2 worth
#> 1 pear pear NA
#> 2 grape pear -0.06
#> 3 banana pear 0.36
#> 4 apple pear 0.25
#> 5 pear grape 0.06
#> 6 grape grape NA
#> 7 banana grape 0.39
#> 8 apple grape 0.29
#> 9 pear banana -0.36
#> 10 grape banana -0.39
#> 11 banana banana NA
#> 12 apple banana -0.17
#> 13 pear apple -0.25
#> 14 grape apple -0.29
#> 15 banana apple 0.17
#> 16 apple apple NA
pair_dat$player1 = factor(pair_dat$player1, levels = lvls)
pair_dat$player2 = factor(pair_dat$player2, levels = rev(lvls))
pair_dat$worth = round(pair_dat$worth, 2)
ggplot(pair_dat,
aes(x = player2,
y = player1,
fill = worth,
label = worth)) +
geom_tile(show.legend = FALSE) +
geom_text() +
scale_fill_gradient2(low = "#b2182b",
high = "#2166ac",
na.value = "white") +
scale_x_discrete(position = "top") +
theme_bw() +
theme(axis.text = element_text(color = "grey10"),
strip.text.x = element_text(color = "grey10"),
axis.text.x = element_text(angle = 90, hjust = 0),
panel.grid = element_blank()) +
labs(x = "",
y = "",
fill = "")
#> Warning: Removed 4 rows containing missing values or values outside the scale range
#> (`geom_text()`).