Returns the covariates used to split a recursive partitioning tree and the rules that were applied to build the tree
Arguments
Value
a vector with the node labels, a data.frame with node rules, a ggplot object
Details
multcomp = TRUE adds multi-comparison letters from multcompView ci.level = numeric for the confidence interval levels
Examples
# \donttest{
library("PlackettLuce")
library("ggplot2")
data("beans", package = "PlackettLuce")
G = rank_tricot(data = beans,
items = c(1:3),
input = c(4:5),
group = TRUE,
additional.rank = beans[c(6:8)])
pld = cbind(G, beans[,c("maxTN", "season", "lon")])
tree = pltree(G ~ maxTN + season + lon, data = pld)
node_labels(tree)
#> [1] "maxTN" "season"
node_rules(tree)
#> node rules
#> 1 3 maxTN <= 18.7175 & season = Ap 15, Pr 16
#> 2 4 maxTN <= 18.7175 & season = Po 15, Po 16, Ap 16
#> 3 5 maxTN > 18.7175
top_items(tree)
#> Node3 Node4 Node5
#> 1 Local INTA Sequia INTA Sequia
#> 2 INTA Sequia Local INTA Centro Sur
#> 3 INTA Rojo SJC 730-79 BRT 103-182
#> 4 INTA Ferroso INTA Matagalpa PM2 Don Rey
#> 5 INTA Centro Sur INTA Centro Sur Local
plot(tree)
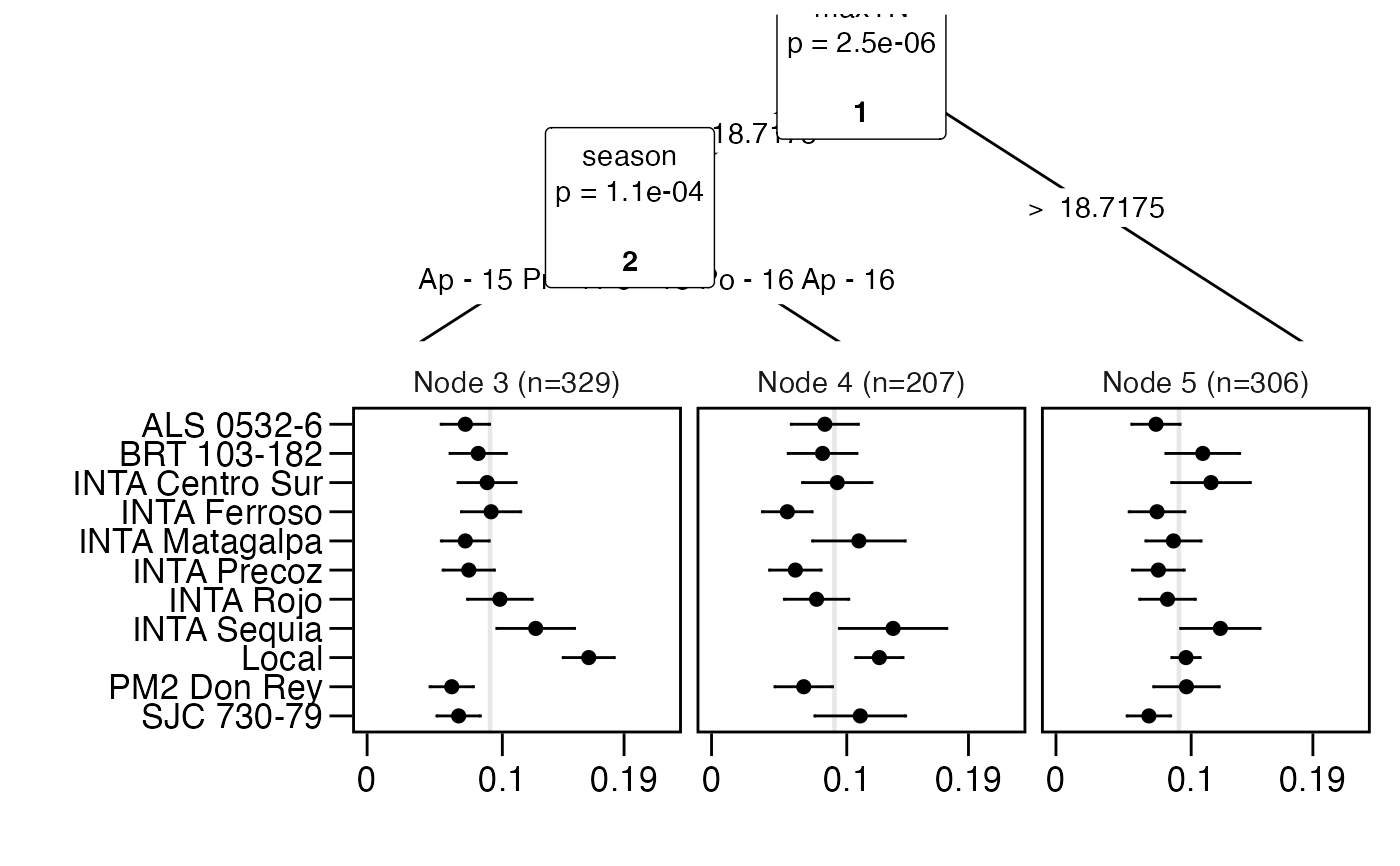
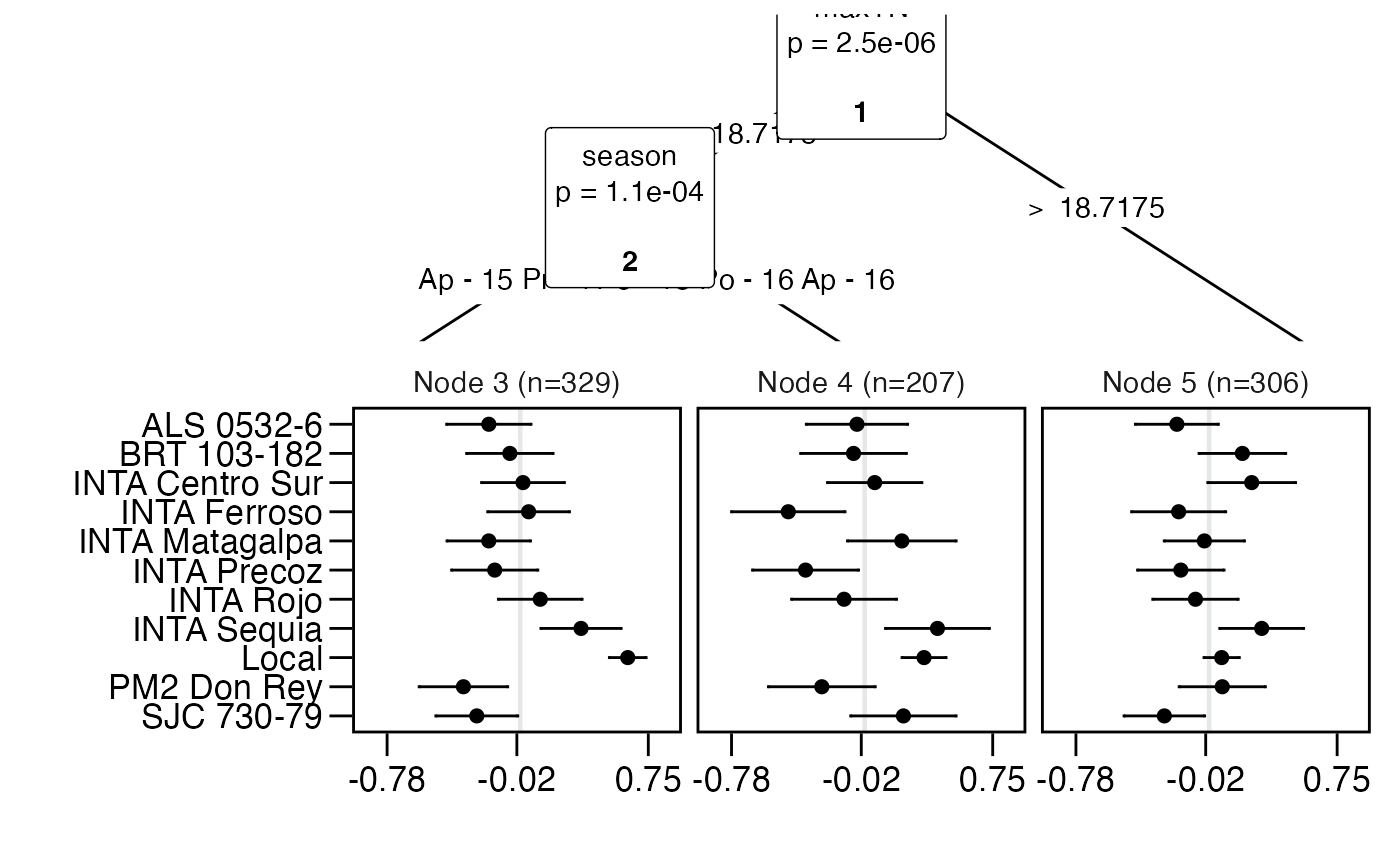 plot(tree, log = FALSE)
 #################################
# Plot PlackettLuce
R = matrix(c(1, 2, 4, 3,
4, 1, 2, 3,
2, 4, 1, 3,
1, 2, 3, 0,
2, 1, 4, 3,
1, 4, 3, 2), nrow = 6, byrow = TRUE)
colnames(R) = c("apple", "banana", "orange", "pear")
R = as.rankings(R)
mod = PlackettLuce(R)
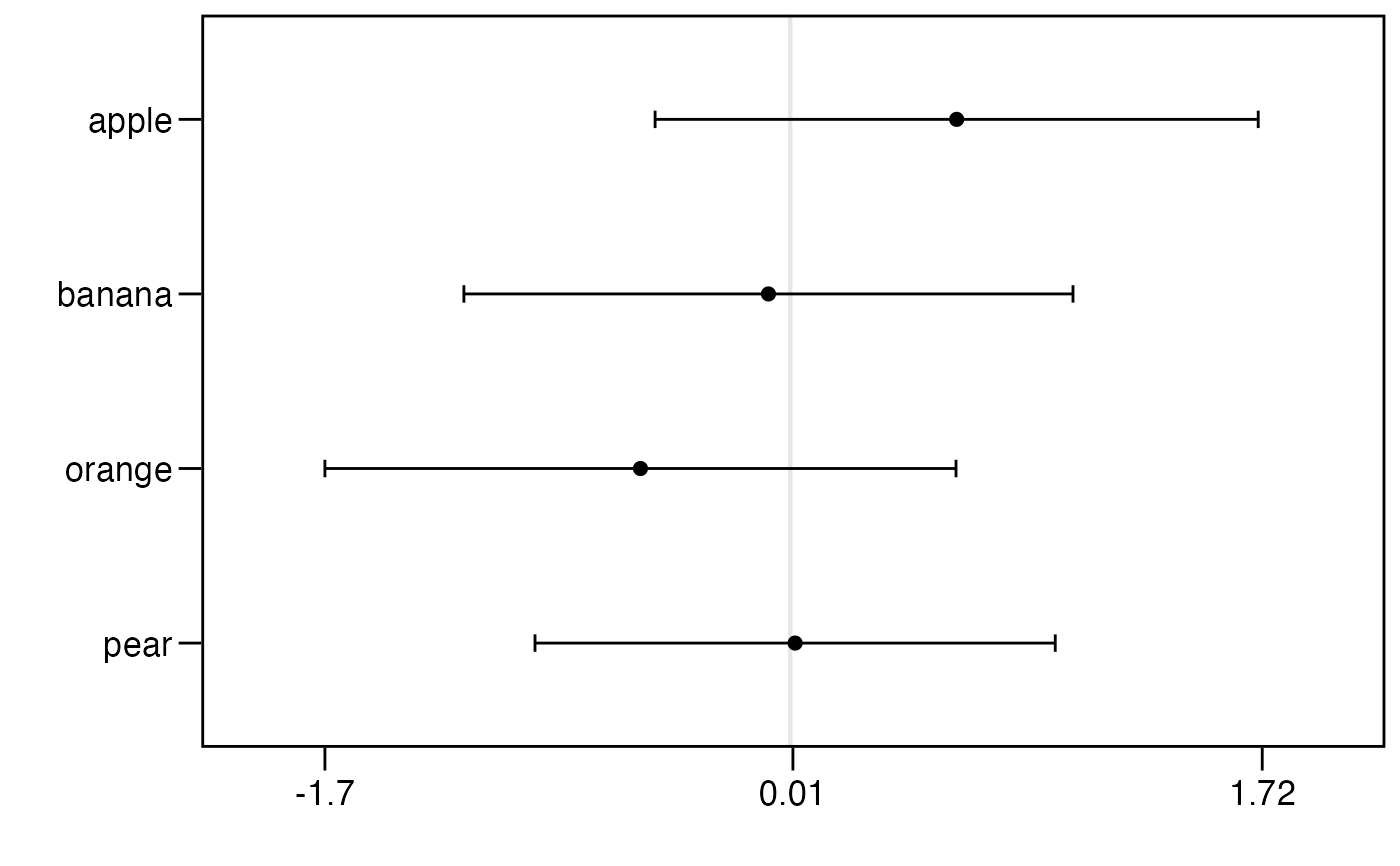
plot(mod)
#################################
# Plot PlackettLuce
R = matrix(c(1, 2, 4, 3,
4, 1, 2, 3,
2, 4, 1, 3,
1, 2, 3, 0,
2, 1, 4, 3,
1, 4, 3, 2), nrow = 6, byrow = TRUE)
colnames(R) = c("apple", "banana", "orange", "pear")
R = as.rankings(R)
mod = PlackettLuce(R)
plot(mod)
 # }
# }